


Most districts don't have an edtech problem. They have a pipeline problem. Tools get bought in one office, provisioned in another, tested nowhere, and then handed to teachers who quietly stop using them by October. Nobody is exactly at fault, because no single person owns the full flow from "we should buy this" to "kids are actually learning with it."
That gap is where money leaks and trust erodes. A district can hold 60+ active licenses and genuinely use maybe a dozen. The rest sit in a spreadsheet somewhere, auto-renewing, with a login screen almost nobody visits.
So this isn't a listicle of procurement tips. It's a walk through the full pipeline — where each stage connects to the next, where the handoffs break, and what a functioning district edtech governance playbook actually looks like when it runs end to end.
The pipeline nobody actually owns
Think of edtech governance as a relay race with four legs: procurement → integration and testing → vendor-risk monitoring → teacher adoption. Each leg has a different owner. Procurement often lives with a curriculum director or business office. Integration sits with IT. Vendor risk drifts between IT, legal, and whoever last read a FERPA memo. Adoption belongs to instructional coaches and building leaders.
The relay breaks at the baton pass. Curriculum picks a tool without asking whether it can roster from the SIS. IT gets a signed contract and only then discovers the vendor doesn't support the district's single sign-on. By the time a coach is asked to drive adoption, teachers have already been burned by a clunky first login and written the tool off.
What you see across districts of very different sizes is that the failure is almost never the product itself. It's that the four legs are managed as separate projects instead of one continuous flow with shared data and shared checkpoints. The tool that "didn't work" usually worked fine — it just entered the building through a broken pipeline.
Here's the data flow, described plainly, because this is the spine of everything below:
A purchase request enters → runs against a procurement rubric → if it scores through, it hits an integration gate (rostering, SSO, data-export test) → passes into a vendor-risk register (contract terms, data handling, renewal date) → then triggers an adoption plan with 30/60/90 milestones → usage data flows back to the register, which informs the next renewal decision.
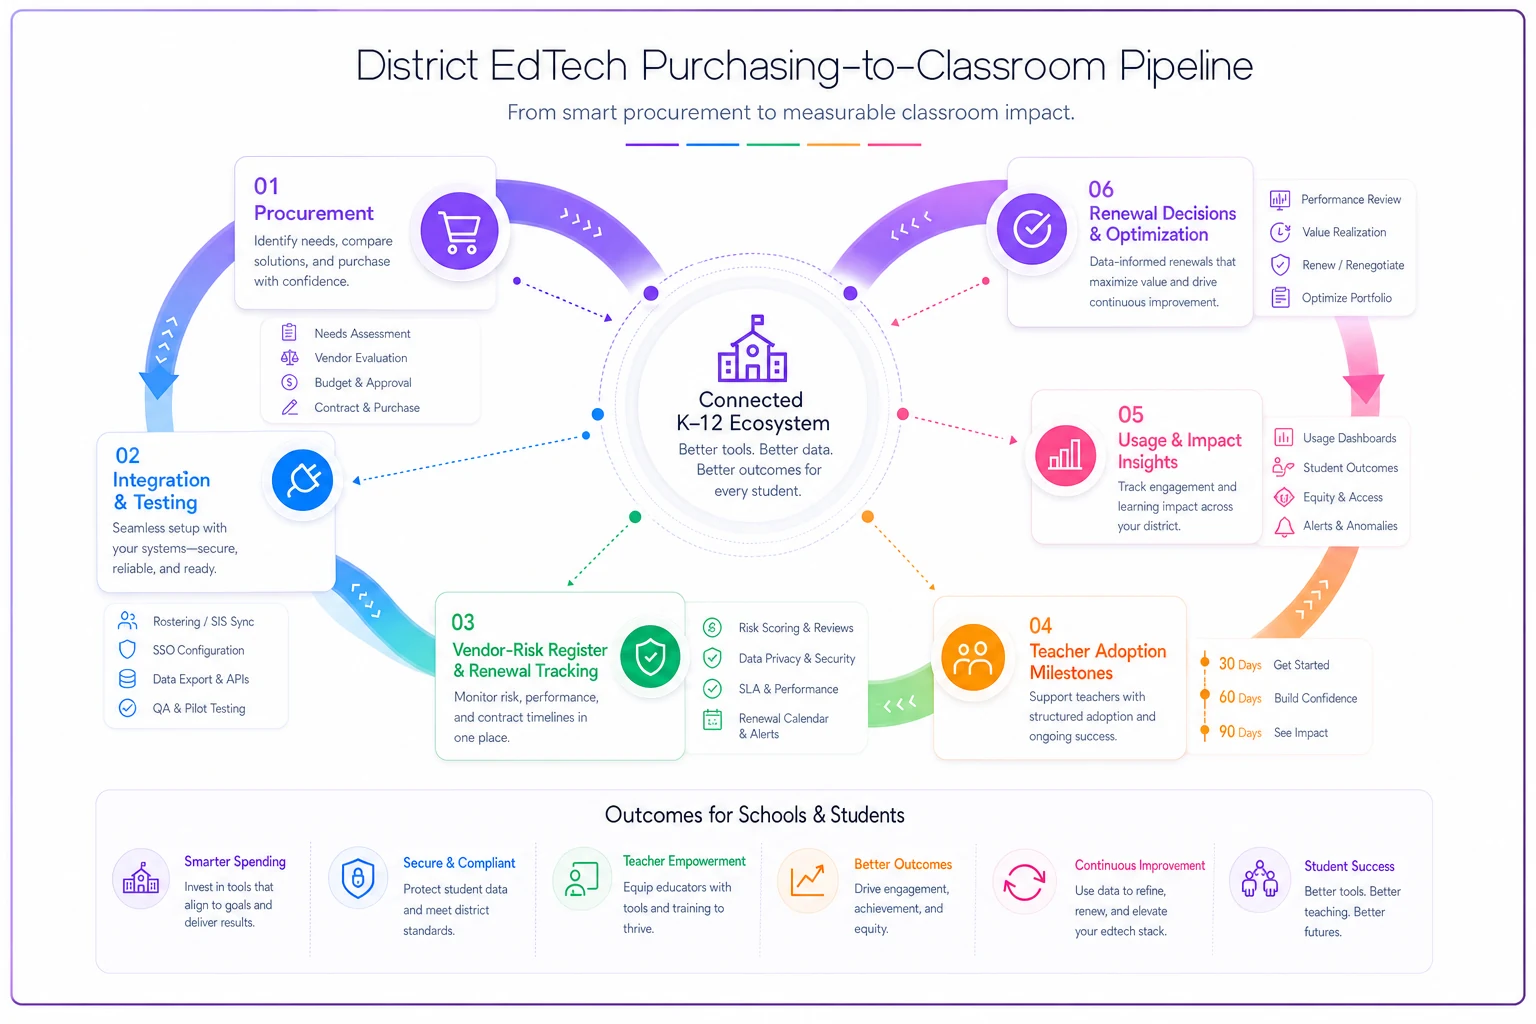
Notice the loop at the end. Usage data feeds the renewal. Without that loop, you renew things by habit.
Stage one: a procurement rubric that filters before the demo dazzles you
The most expensive decisions get made emotionally. A vendor gives a slick demo, a passionate teacher champions it, and suddenly there's momentum toward a five-figure contract that never got scored against anything.
Keep every student on track with ease.
Skolyly helps you create, assign, and monitor classroom activities efficiently.
- Integrated lesson and assignment management
- Real-time student progress tracking
- Automated class scheduling & notifications
No credit card required
A rubric fixes that by forcing the same questions on every tool, before anyone falls in love. It doesn't have to be complicated — it has to be consistent. The point isn't to produce a perfect score; it's to surface the disqualifiers early, when saying no is still cheap.
A workable rubric weighs five buckets:
| Category | What you're actually scoring | Weight |
|---|---|---|
| Instructional fit | Ties to a real standard/gap, not a "nice to have" | 25% |
| Interoperability | Rosters from SIS, supports SSO, exports data cleanly | 25% |
| Data privacy & compliance | Contract terms, data residency, sub-processors, deletion | 20% |
| Total cost of ownership | License + PD time + support burden, not just sticker price | 15% |
| Adoption realism | How many teachers, how much training, redundancy with existing tools | 15% |
The interoperability and privacy buckets are weighted heavily on purpose. A tool can be pedagogically wonderful and still be a nightmare if it won't roster automatically or if its data terms are vague. Those two categories are where the downstream pipeline lives or dies.
One pattern worth naming: redundancy is the silent budget killer. Districts routinely buy something new that overlaps 70–80% with a tool they already license. The rubric should force a direct comparison — "what does this do that our current stack doesn't?" — and a lot of purchases quietly die right there, which is the point.
For a deeper treatment of the privacy scoring side, the vendor-checklist logic pairs well with our K-12 student data privacy playbook, which covers retention windows, consent, and the contract language that should be non-negotiable before anything gets signed.
Stage two: interoperability and testing gates (the leg most districts skip)
This is the stage that gets skipped most often, and it's the one that quietly wrecks adoption.
A tool passes the rubric, the contract gets signed, and then it goes straight into teachers' hands with no technical shakedown. The first time anyone tests rostering is when a teacher opens period 3 and half the class list is missing or duplicated. That teacher now associates the tool with frustration on day one, and no amount of later PD fully undoes it.
An integration gate is a short, mandatory checklist that a tool must clear after purchase but before it reaches classrooms. Run it in a pilot section or a sandbox environment first.
The integration gate checklist:
-
Does it roster automatically from the SIS, and does the roster update when kids move sections?
-
Does single sign-on work — one login, no separate password teachers have to reset every week?
-
Can you export student data in a usable format, and can you delete it on request?
-
Does it connect to the gradebook, or does it create a second place where grades live?
-
What's the support path when it breaks at 8
05 a.m. before first period?
-
Does it degrade gracefully on the district's actual devices and bandwidth, not the vendor's demo laptop?
Run integration tests in a sandbox pilot before wider deployment to catch rostering and SSO issues early.
Rostering and SSO are the two that predict adoption most reliably. A tool teachers can reach in one click, with their real class list already populated, gets used. A tool that requires a separate password and manual roster upload gets abandoned — not because it's bad, but because friction compounds. Every extra step is a small tax, and teachers pay it dozens of times a day until they stop.
Treat this gate as a hard stop. If a tool fails rostering or SSO, it doesn't ship to buildings until the vendor fixes it or you've built a workaround. Shipping a broken integration and hoping teachers push through is how you burn goodwill you'll need later.
Stage three: a living vendor-risk register, not a one-time contract review
Vendor risk is usually treated as a signing-day event. Somebody reviews the data terms once, files the contract, and moves on. Then the tool sits in the environment for three years while the vendor changes sub-processors, gets acquired, adds a feature that ingests student work, or auto-renews at a higher rate — and nobody revisits any of it.
A risk register turns that one-time check into an ongoing record. It's a simple table with a row per active tool, and honestly it's the single most useful artifact a governance pipeline produces.
Each row should track:
-
Tool name and owner — the human accountable for it, not just the department.
-
Data classification — does it touch PII, and what fields?
-
Contract terms and renewal date — surfaced before the renewal window, not after auto-renewal.
-
Data handling — sub-processors, residency, deletion terms, and whether those have changed since signing.
-
Integration status — is rostering/SSO still working, or did a vendor update break something?
-
Usage signal — active teachers, active students, last-30-day activity.
-
Renewal recommendation — renew, renegotiate, or sunset.
The renewal-date column alone pays for the whole exercise. Districts lose real money to auto-renewals nobody flagged. A tool bought for a specific initiative rolls over for two extra years after that initiative ended, only caught during a budget crunch when someone finally audits the line items.
The register also connects backward to procurement. When a new tool comes up for review, you check for overlap. When a tool's usage signal is near zero, the renewal recommendation writes itself. This is where the pipeline's feedback loop physically lives.
Stage four: teacher adoption milestones (where good tools go to die)
A tool can clear the rubric, pass every integration gate, and sit clean in the risk register — and still fail completely because teachers don't use it.
Adoption isn't an event you announce at an August in-service. It's a curve you manage over a semester with checkpoints. The 30/60/90 structure works because it matches how teachers actually absorb new tools — slowly, then either sticking or abandoning based on early friction.
30 days — access and first use. Every intended teacher can log in and has used the tool at least once for something real. If you're below roughly 70% of teachers logging in by day 30, the problem is almost always access friction, not motivation. Fix the login, don't lecture the teachers.
60 days — routine use. The tool is showing up in normal instruction, not just in the one lesson someone modeled during PD. This is where coaching matters most. Teachers who hit a snag around week five and get no help are the ones who quietly drop off.
90 days — embedded and producing signal. The tool is part of the workflow and generating usage data that flows back to the register. If a tool is still at "occasional" by 90 days, that's your answer — it's a candidate to sunset at renewal, regardless of how good the demo was.
The mistake districts make is measuring adoption by license count. "We have 400 seats" tells you nothing. Active teachers in the last 30 days tells you everything. For the mechanics of building adoption that actually holds, the piece on stopping low adoption with a school-wide cycle breaks down the routines that keep usage from collapsing after the launch buzz fades.
The KPIs that actually tell you if the pipeline works
Districts drown in vanity metrics. Seats purchased, logins created, "tools available" — none of it tells you whether the pipeline is healthy. A handful of numbers actually do.
-
Active-usage rate — active teachers ÷ intended teachers, tracked at 30/60/90.
-
Integration pass rate — % of purchased tools that clear the gate on the first attempt. A low rate means the rubric isn't catching interoperability problems early enough.
-
Redundancy rate — % of active tools with significant overlap. High overlap means the procurement filter is leaking.
-
Renewal hygiene — % of renewals that got a usage-based decision vs. auto-renewed by default.
-
Time-to-classroom — days from contract signing to teachers actively using the tool. Long lag usually points to a skipped or slow integration gate.
-
Cost-per-active-user — total cost ÷ active users. This is the number that makes a bad tool impossible to defend at renewal.
Cost-per-active-user is the one to put in front of a board. A $40k tool with 25 active teachers is a very different conversation than $40k with 250. It reframes the discussion from "was this a good product" to "did this reach anyone," which is the question that should drive renewals.
For turning these into something leadership actually reads and acts on, the framing in our data visualization guide for school leaders is directly useful — a one-page narrative brief beats a 20-tab dashboard every time someone has to make a cut.
Where this makes sense — and where it's overkill
A full pipeline isn't free. It costs coordination time, and for a very small district running six tools, a heavyweight process creates more overhead than it's worth.
This makes sense when: you're running 20+ active tools, multiple departments buy independently, contracts renew on staggered dates nobody tracks centrally, or you've been burned by an auto-renewal or a data-privacy scare. At that scale, the pipeline pays for itself by killing redundant purchases alone.
This is overkill when: you're a small operation with a handful of core tools and one person who already knows every contract in their head. Don't build a four-stage register to manage six things. A lightweight rubric is enough.
Who should not start here: districts in the middle of a total SIS migration. Your interoperability gate depends on a stable rostering source. Stabilize the SIS first, then build the pipeline around it — otherwise every integration test fails for reasons that have nothing to do with the tools themselves.
A real scenario: a mid-sized district's tool audit
A district of roughly 4,500 students had accumulated somewhere around 50 active edtech subscriptions over several years, bought across three departments with no central register. Annual edtech spend was somewhere north of $200k, and nobody could say with confidence which tools were actually used.
They ran the pipeline backward as an audit — pulling last-30-day active usage on every tool. The results were rough but predictable: about a third of the tools had almost no active teachers, several pairs overlapped heavily, and four subscriptions had auto-renewed for at least a year past the initiative that originally justified them.
The fix wasn't dramatic. They sunset the near-zero-usage tools, consolidated two overlapping literacy platforms into one, and moved every remaining contract into a shared register with renewal dates flagged 90 days out. The cut freed up somewhere in the range of $30k–$45k annually — not headline-grabbing, but enough to fund coaching time for the tools they did keep.
The more durable win was cultural. Once teachers saw that unused tools got cut and the surviving ones came with real support, the "just one more platform" fatigue eased. Adoption on the remaining stack climbed, because the pipeline stopped shipping half-working tools into their classrooms.
The takeaway
Edtech governance falls apart when four separate offices manage four separate legs of the same race and nobody watches the handoffs. The rubric stops bad purchases. The integration gate stops broken rollouts. The risk register stops silent renewals and privacy drift. The adoption milestones stop good tools from dying quietly. And the usage loop at the end feeds the next purchasing decision so you stop buying by habit.
You don't need to build all four stages at once. Start with a register of what you already own and pull active-usage numbers on every tool — that single move surfaces redundant purchases, ghost subscriptions, and auto-renewals faster than anything else. Once you can see the whole pipeline in one place, the decisions that used to feel political start making themselves.
Ready to elevate your classroom management?
Join 5,000+ educators using Skolyly to save time, engage students, and improve learning outcomes.