



Most districts don't renew software because it works. They renew because canceling feels harder than keeping. The invoice shows up, someone remembers the training everyone sat through, a principal says "the third-grade team likes it," and the PO goes out again. Nobody actually checked whether teachers logged in past October.
That's the quiet money leak in K-12 tech budgets. Not the tools that fail loudly — those get dropped fast. It's the ones sitting at 22% adoption, costing $18 a seat, coasting through renewal because no one built a system to catch them. A renewal scorecard fixes that by forcing every tool through the same evidence-based gate before the check clears.
This isn't about being cheap. It's about making renewal a decision instead of a default.
Why renewals go bad even when procurement was good
You can run a clean purchase and still end up with a bad renewal. The two decisions are separated by a full year with almost nothing connecting them. Procurement asks "should we buy this?" Renewal should ask "did this actually earn its keep?" — but most districts end up asking the first question twice.
Part of it is timing. Renewal windows land in spring, right when everyone is buried in state testing, master scheduling, and staffing decisions. Signing is the path of least resistance. Part of it is that the person approving the renewal usually isn't the person who knows whether teachers actually use the thing. Finance sees a line item. The instructional side sees a login they forgot the password to.
And part of it is that nobody agreed at purchase on what "working" even means. Without that definition set upfront, every renewal turns into a debate about feelings. Someone will always defend a tool. Someone else will always hate it. Neither position scales across 40 subscriptions.
A good renewal scorecard borrows the same discipline you'd use in a district edtech governance pipeline — clear gates, agreed thresholds, evidence instead of opinion. The difference is that the scorecard runs after deployment, when you finally have real usage data instead of a vendor demo.
The five dimensions that actually predict a good renewal
A renewal decision that only looks at usage is thin. A tool can have high logins and zero instructional impact. Another can have modest usage but genuinely change how a whole grade team teaches. You need to score across five dimensions, weighted so no single number wins the argument.
Keep every student on track with ease.
Skolyly helps you create, assign, and monitor classroom activities efficiently.
- Integrated lesson and assignment management
- Real-time student progress tracking
- Automated class scheduling & notifications
No credit card required
| Dimension | What it measures | Suggested weight | Red flag |
|---|---|---|---|
| Adoption | Are teachers actually using it, consistently? | 25% | Under 40% weekly active among assigned staff |
| Fidelity | Is it used the way it's meant to be used? | 20% | Used as a worksheet dispenser when it's an adaptive tool |
| Impact | Movement on the outcome it was bought for | 30% | No measurable change after two full evidence windows |
| SLAs / reliability | Uptime, support response, roster sync accuracy | 10% | Repeated outages during instruction, slow ticket resolution |
| Cost-per-student | True per-active-student cost, not per-seat | 15% | Cost per active student is 3x+ the per-seat price |
Impact carries the most weight on purpose. A tool everyone uses that moves nothing is still a failure — just a popular one. Cost-per-student is deliberately calculated on active students, not licenses purchased, because that's where the real waste hides. A $12 per-seat tool used by a third of assigned teachers is functionally a $36 tool.
The fidelity dimension is the one districts skip most, and it's often the most revealing. An adaptive reading platform used as a study-hall time filler isn't the product you bought. Fidelity separates "teachers open it" from "teachers use it as designed." You can only judge that by looking at how it's used, not just whether it is — which means someone has to actually observe or sample usage patterns, not just pull a login report.
Evidence windows: 30, 60, 90, 180 days
Scoring a tool on week-two data is how you kill promising tools too early and prop up bad ones too long. Different signals mature at different speeds, so the scorecard reads them on a schedule.
-
30 days — Setup and access only. Are rosters synced, are logins working, did the training land? This window catches deployment failures, not instructional value. Don't judge impact here; you'll mostly be measuring the novelty spike.
-
60 days — Early adoption pattern. Is usage climbing, flat, or already collapsing? A tool that's dropping at 60 days rarely recovers without active intervention. This is your first real behavioral read.
-
90 days — Fidelity check. Now there's enough usage to sample how it's being used. Compare intended use against actual use across a handful of classrooms.
-
180 days — Impact window. Enough time has passed to look at the outcome it was bought to move: benchmark growth, intervention completion, whatever the original goal was.
The mistake is collapsing all four into one spring snapshot. By spring, you can't tell whether a tool failed at setup, at adoption, or at impact — and each has a completely different fix. A setup failure means retrain. An adoption failure means the workflow doesn't fit the teacher's day. An impact failure means the tool just doesn't work, no matter how well it's used.
If you've already built a schoolwide fidelity framework for instructional programs, the sampling logic transfers directly here. Same kind of classroom evidence — you're just pointing it at a vendor decision instead of a curriculum one.
Stop and scale thresholds you set before you look
Thresholds have to be written down before you run the numbers, or they become negotiable after the fact. The whole point is to remove the "well, but" conversation. Here's a workable default set:
Stop (do not renew, or renew only after major renegotiation):
-
Weekly active teachers below 40% of assigned staff at the 90-day window
-
No measurable impact after the 180-day window despite adequate usage
-
Cost per active student more than 2.5x the per-seat quote
-
Repeated SLA breaches that cost instructional time
Hold (renew short-term with a corrective plan):
-
Adoption between 40–65% with an upward trend
-
Impact unclear but fidelity is genuinely low — the tool hasn't had a fair test yet
-
Support issues that are annoying but not instruction-killing
Scale (renew and expand):
-
Weekly active above 70% with strong fidelity
-
Clear impact on the target outcome at 180 days
-
Cost per active student at or near the per-seat price, meaning most assigned users actually show up
The "Hold" category is what most districts are missing. Right now the choice is binary: renew or cut. A tool sitting at 55% adoption with rising usage doesn't need to be killed — it needs one more semester and a fidelity fix. The scorecard lets you say "yes, but with conditions" instead of gambling on a full-year renewal.
One thing worth calling out: low fidelity isn't automatically a reason to cut. It often means the rollout failed, not the tool. If teachers were never shown how to use the adaptive features, the tool never got a fair trial. There's a real difference between "tool doesn't work" and "we didn't implement it right" — because the second one is on the district, not the vendor.
The renewal-decision matrix
Once you have the scores and the windows, the actual decision falls out of a simple matrix crossing adoption against impact. This is the part you can hand to a cabinet in five minutes.
| Adoption / Impact | **Low impact** | **High impact** |
|---|---|---|
| High adoption | Investigate fidelity, then likely cut. Popular but pointless. | Scale. This is your keeper. |
| Low adoption | Cut. No one uses it and it does nothing. | Fix adoption before you lose a tool that works. |
The bottom-right cell — high impact, low adoption — is where the most expensive mistakes happen in both directions. Cut it and you lose something that genuinely helps the classrooms using it. Blindly renew it and you keep paying full price for a fraction of the value. The right move is a targeted adoption push tied to a short-term renewal, then rescore.
The top-left cell is the sneaky one. High adoption with low impact feels like success because the dashboards look green. Teachers log in, students click, engagement metrics glow — and benchmark scores don't budge. Before cutting, check fidelity. Are teachers using the parts that matter, or just the easy parts?
A real scenario: the reading platform that almost auto-renewed
A mid-sized district — around 6,200 students across nine schools — had a supplemental reading platform up for renewal at roughly $47k a year. On paper it looked fine. The literacy coordinator liked it. Training had happened. It felt established.
Running it through the scorecard changed the picture. Adoption at the 90-day window was around 38% weekly active among assigned teachers — just under the stop threshold. Cost per active student came out close to three times the per-seat number, because more than half the paid licenses were essentially dormant. But the 180-day impact data on the classrooms that did use it consistently showed real benchmark growth in early readers.
Bottom-right cell: it worked where it was used, but it wasn't used enough. Instead of renewing at $47k or cutting outright, the district renewed a scaled-down license set for around $22k, concentrated on the grade bands showing impact, and ran a one-semester adoption fix. Next cycle, adoption in that narrower group climbed past 70% and cost-per-active-student dropped in line with the per-seat price. They kept a tool that worked and stopped paying for the half nobody touched — roughly $25k redirected without losing a single effective classroom.
The tool didn't change. The decision framework did.
Running the scorecard without drowning in it
The obvious objection: who has time to score 40 subscriptions across four evidence windows every year? If the scorecard becomes a spring research project, it dies the first year.
The way to keep it alive is to stop treating renewal as an event and treat it as running data collection.
Here's the workflow that holds up across a full portfolio:
-
At purchase, write the success definition. Target outcome, adoption threshold, and the impact metric — logged in the same record as the contract. This is the single highest-leverage step, and it costs about ten minutes.
-
Pull usage exports on a schedule, not on demand. Most platforms can send weekly or monthly active-user data. Standardize the fields so every tool reports the same way.
-
Sample fidelity in batches. You don't observe every classroom. Sample a handful per tool during the 90-day window, the same way you'd sample for any implementation check.
-
Auto-flag against thresholds. Any tool crossing a stop line gets surfaced automatically, so you're only spending attention on the ones that actually need a decision.
-
Score only the flagged and the up-for-renewal. A tool cruising at 80% adoption with clear impact doesn't need a meeting. Reserve human review for the ambiguous middle.
This is where centralizing the data earns its place. When roster sync data, usage exports, and impact metrics live in one workflow instead of scattered across vendor dashboards and someone's spreadsheet, the scorecard mostly fills itself in. AI-assisted operational tools can pull usage feeds, normalize the fields, and flag threshold breaches before renewal season — so the human work shrinks to judgment calls on borderline tools instead of manual data-hunting across 40 portals.
A quick checklist to know if you're ready to run this:
-
- [ ] Every active subscription has a written success definition from purchase
-
- [ ] You can pull active-user data (not just license counts) per tool
-
- [ ] You've set stop/hold/scale thresholds before looking at any numbers
-
- [ ] Renewal dates are calendared with a 90-day lead, not discovered at invoice time
-
- [ ] Someone owns the fidelity sampling, not just the usage numbers
-
- [ ] Finance and instructional leadership review the same scorecard
If you can't check the first two, start there. You can't score what you can't measure, and license counts tell you nothing about whether a tool is actually used.
Here's a simple workflow diagram of that process.
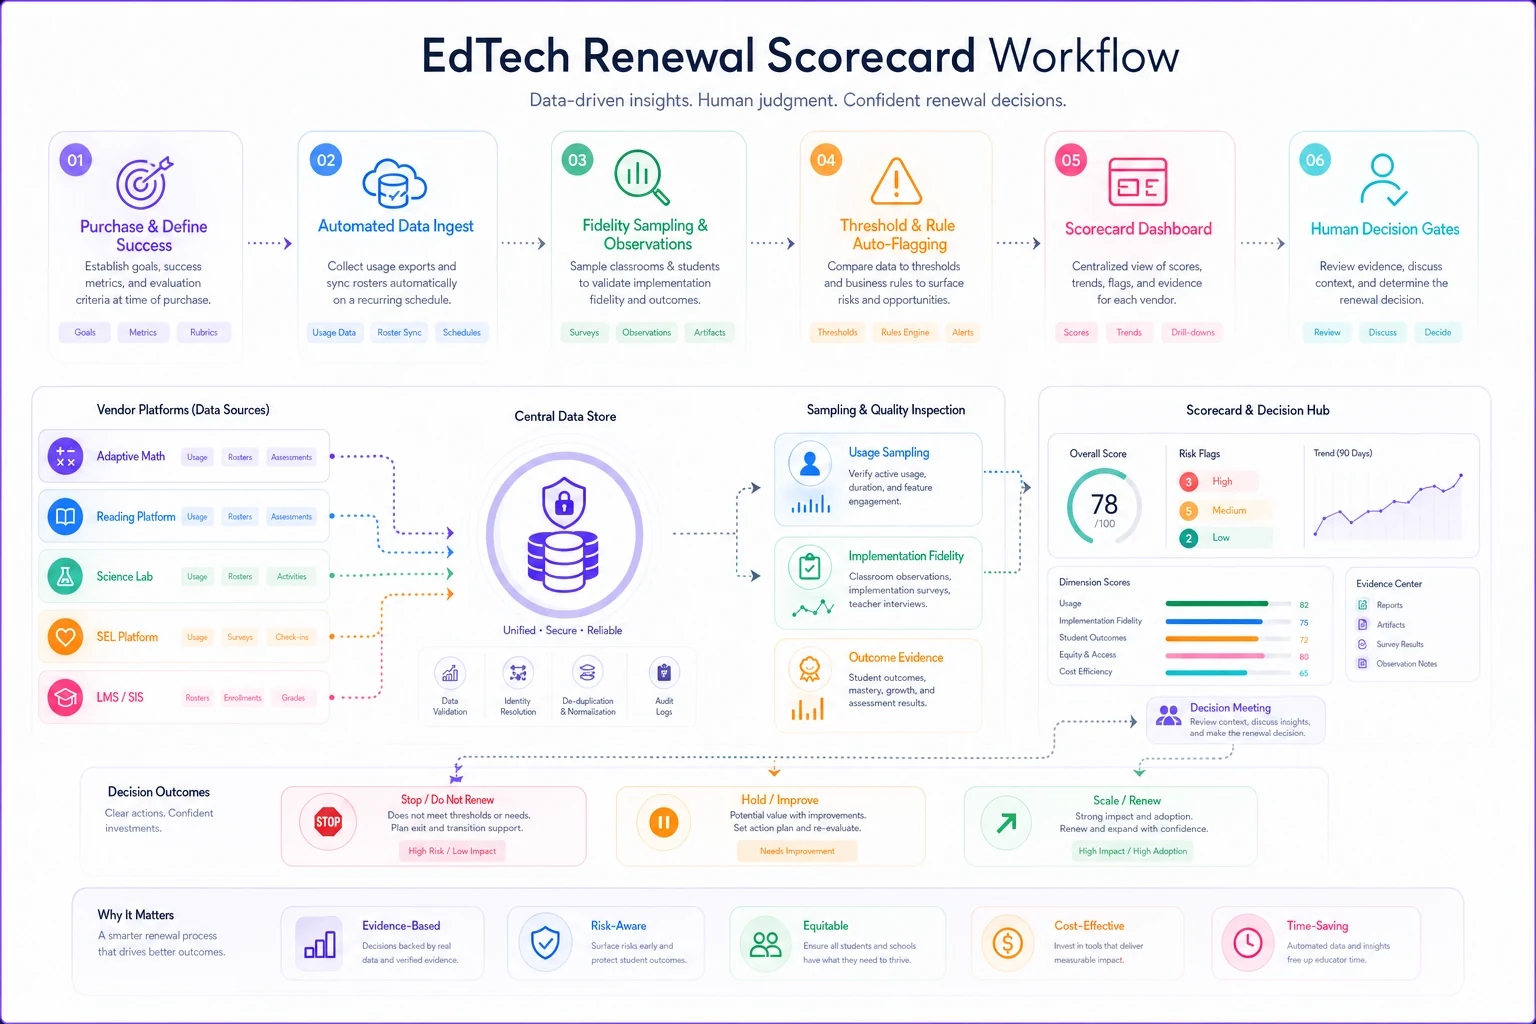
The point isn't automation for its own sake; it's that nobody has time to do this by hand across a full portfolio, and the tools that go un-reviewed are exactly the ones that quietly auto-renew.
When this framework is overkill
The scorecard is built for portfolios, not single tools. If a school runs three subscriptions total, this is too much machinery — a principal can hold that in their head. It earns its keep somewhere north of ten to fifteen tools, where no single person can track adoption and impact across all of them anymore.
It's also a bad fit for infrastructure tools where "adoption" isn't a meaningful concept — your SIS, network filtering, the things that either run or don't. Judge those on reliability and cost, and leave them out of the adoption-impact matrix entirely.
Don't apply stop thresholds to tools still inside their first evidence windows, either. Cutting something at 45 days because adoption is at 30% is just punishing the novelty curve. The whole reason for staged windows is to avoid killing tools before they've had a fair run.
The real shift
The change here isn't a spreadsheet. It's moving the burden of proof. Right now, the default is renewal, and someone has to make an active case to cut a tool. Flip that. Make the default no renewal, and require every tool to earn its spot with evidence — adoption, fidelity, impact, reliability, and honest cost-per-active-student.
Most districts are carrying two or three subscriptions right now that would fail their own thresholds if anyone actually measured them. Not because the tools are scams, but because nobody built the gate. The scorecard is that gate. Run it once, and the next spring stops being a scramble of defending line items and becomes a short list of clear decisions — keep, cut, or fix — backed by the same evidence for every tool.
The change here isn't a spreadsheet. It's moving the burden of proof. Right now, the default is renewal, and someone has to make an active case to cut a tool. Flip that. Make the default no renewal, and require every tool to earn its spot with evidence — adoption, fidelity, impact, reliability, and honest cost-per-active-student.
Most districts are carrying two or three subscriptions right now that would fail their own thresholds if anyone actually measured them. Not because the tools are scams, but because nobody built the gate. The scorecard is that gate. Run it once, and the next spring stops being a scramble of defending line items and becomes a short list of clear decisions — keep, cut, or fix — backed by the same evidence for every tool.
Ready to elevate your classroom management?
Join 5,000+ educators using Skolyly to save time, engage students, and improve learning outcomes.