


The fourth-grade team at Washington Elementary meets every Wednesday at 3:15. Six teachers, one interventionist, and the assistant principal squeeze around a kidney table covered in binders, spreadsheets printed in 8-point font, and sticky notes that somehow keep multiplying.
Ms. Rodriguez pulls up three different Google Sheets on her laptop. The reading interventionist has a paper binder with handwritten notes. The math specialist brings his iPad with data in a district app that nobody else can access. Twenty minutes pass before they even start talking about actual students.
Sound familiar?
Most Tier 2 RTI tracking systems fail because they ask too much from teachers who are already buried in documentation. Teams either abandon the system entirely or burn their collaboration time managing spreadsheets instead of planning interventions.
The weekly data burden that's killing your RTI process
Running Tier 2 interventions without crushing teachers under data requirements is genuinely hard. You need enough information to make decisions, but every additional data point means another form, another column to update, another graph nobody actually looks at.
A middle school tried to implement a comprehensive RTI tracking system a couple years back. They built elaborate spreadsheets with 15+ data fields per student — progress monitoring scores, intervention fidelity checks, behavior observations, parent contact logs, accommodation tracking. The principal was proud of how "data-driven" they were becoming.
By October, teachers had stopped updating it. The interventionist was the only one still entering data, and she admitted she was copying last week's numbers just to avoid getting called out in meetings. Their Wednesday RTI huddles had turned into arguments about missing data instead of discussions about student needs.
When your lightweight Tier 2 RTI tracker requires more than 30 seconds per student per week, teachers will find workarounds. They'll estimate. They'll skip entries. They'll quietly resent the whole process.
What actually needs tracking (and what doesn't)
After watching RTI teams across a lot of different schools, clear patterns emerge about which data points actually drive decisions and which ones just create busy work.
Keep every student on track with ease.
Skolyly helps you create, assign, and monitor classroom activities efficiently.
- Integrated lesson and assignment management
- Real-time student progress tracking
- Automated class scheduling & notifications
No credit card required
Essential data that drives intervention decisions:
-
Current intervention and frequency
-
Weeks in current intervention
-
Last progress check score
-
Trend direction (improving/stable/declining)
-
Next decision point
Data that seems important but rarely changes decisions:
-
Detailed attendance percentages
-
Multiple behavior rating scales
-
Extensive anecdotal notes
-
Historical data beyond 6 weeks
-
Parent engagement metrics
A third-grade team in Colorado stripped their tracking down to five fields per student. Their interventionist updates it once weekly in about 8 minutes for her 24 Tier 2 students. During huddles, they project one simple view showing all students' current status and trend arrows. Decisions that used to take 45 minutes of spreadsheet navigation now happen in under 10.
The core question your tracker needs to answer is pretty simple: should this student continue, modify, or exit their current intervention? If a data field doesn't help answer that, it probably doesn't belong there.
Building your minimal tracking framework
A truly lightweight Tier 2 RTI tracker centers on one simple table. Here's the framework that actually gets used week after week:
| Student | Intervention | Week # | Last Score | Trend | Next Step |
|---|---|---|---|---|---|
| Maria S. | Guided reading group | 4 | 68 | ↗ | Continue |
| James T. | Number talks | 6 | 45 | → | Modify |
| Aisha M. | Reading fluency | 3 | 82 | ↗ | Continue |
| David L. | Math facts | 8 | 71 | → | Exit review |
Notice what's missing? No lengthy narratives. No multiple assessment scores. No color-coding that requires a legend to decode. Just the minimum viable data for making a call.
The "Last Score" comes from whatever quick progress monitoring tool you're already using — DIBELS, a curriculum-based measure, a simple accuracy percentage. Consistency matters more than comprehensiveness.
Trend arrows tell the story instantly. Improving means at least 3 points higher than two weeks ago. Stable means within 3 points. Declining means 3+ points lower. This simple visual replaces graphs that take forever to generate and interpret.
Below is a rough picture of how data flows through a minimal Tier 2 cycle each week:
[Classroom Teacher / Interventionist] ↓ Weekly Progress Check (score + attendance) ↓ Single Tracker Updated (one owner, ~8–10 min total) ↓ 10-Minute Huddle (flag → decide → assign) ↓ Intervention Adjusted or Continued
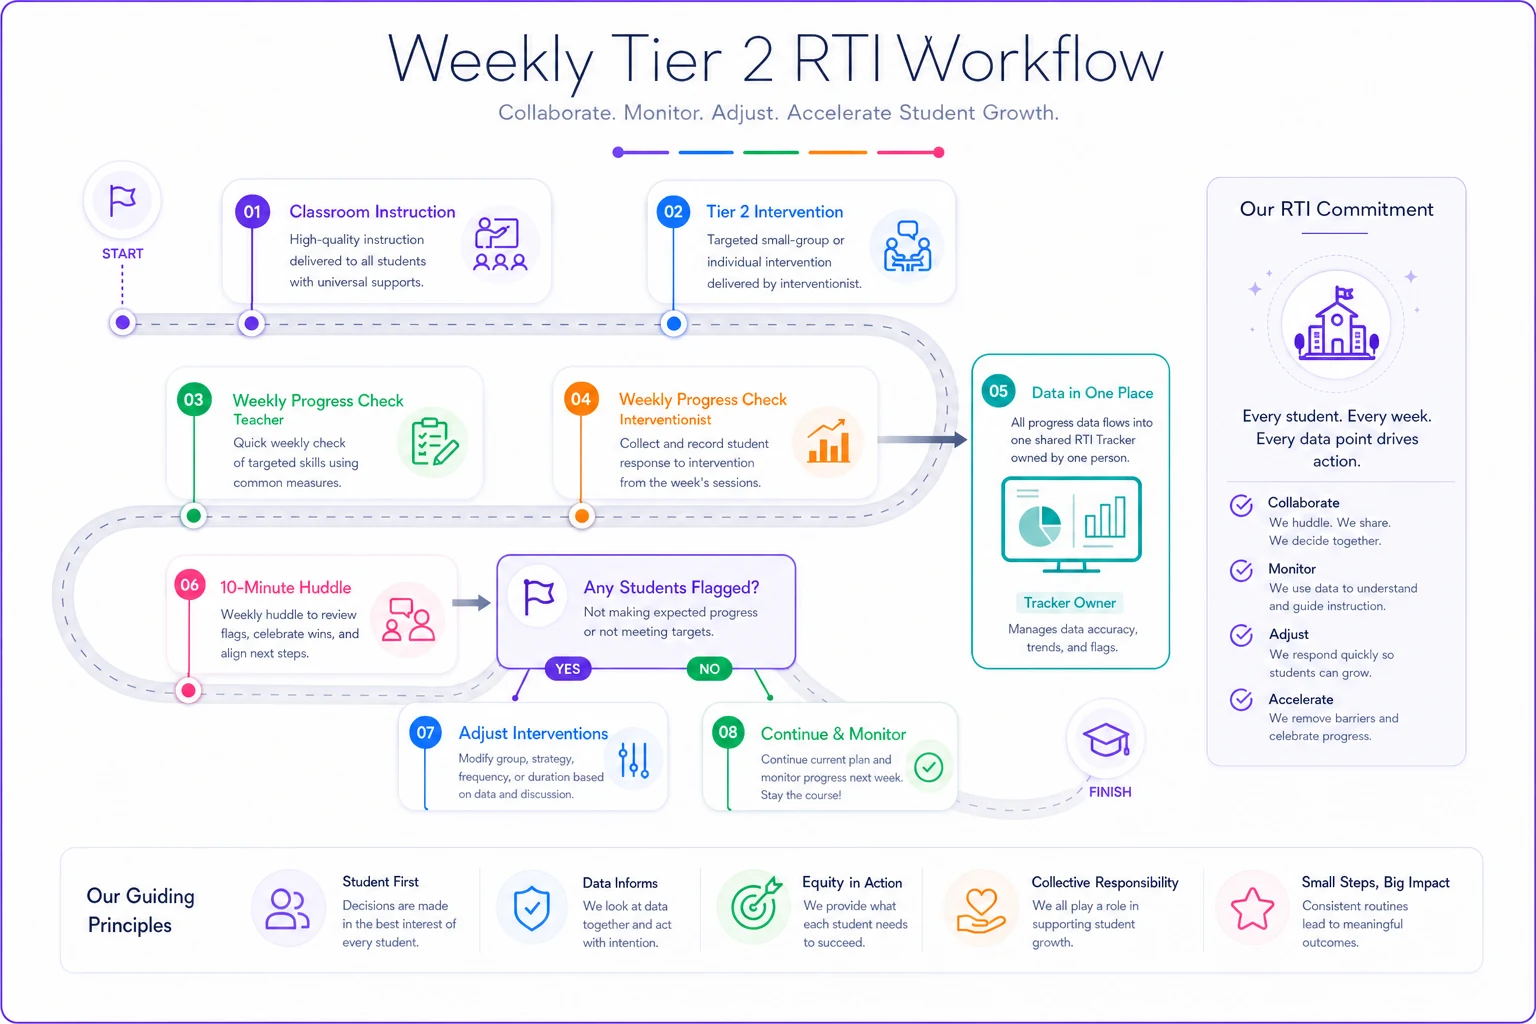
It's not complicated. That's the whole point.
The 10-minute huddle protocol that works
Schools usually schedule 30–45 minute RTI meetings, but most of that time gets wasted on logistics and data hunting. A focused 10-minute huddle with a clear structure accomplishes more than most hour-long marathons.
-
Minutes 1–2 — Status check. Project the tracker. The interventionist quickly highlights any students with declining trends or approaching decision points. No discussion yet, just flagging.
-
Minutes 3–7 — Decision time. Focus only on students who actually need a decision this week: those showing declining trends, students at 6- or 8-week marks, and new referrals from classroom teachers. For each flagged student, ask three questions: Is the intervention being delivered as intended? Is the data showing progress toward the goal? What changes next week?
-
Minutes 8–9 — Quick assignments. Who needs to adjust intervention groups? Who needs to contact parents? Who needs additional assessment?
-
Minute 10 — Lock next week. Confirm next meeting time and any prep needed.
This works because it cuts the time-wasters entirely. No reviewing students who are progressing fine. No lengthy debates about data collection methods. No discussion about whether to use blue or green highlighting.
When teachers actually update the tracker
The biggest challenge with any RTI system isn't the technology or the format — it's getting consistent updates without creating resentment. Three things consistently help.
Strategy 1: Embedded collection. Connect data collection to something teachers already do. If interventionists take attendance in a specific system, add a single field there for the weekly progress check. If teachers already use exit tickets, pull those scores directly without requiring separate entry.
Strategy 2: Single owner. Designate one person — usually the interventionist or RTI coordinator — to maintain the tracker. Teachers verbally report or text their numbers. Takes the interventionist around 10 minutes weekly instead of each teacher spending 5 minutes incorrectly updating different spreadsheets.
Let teachers text or use a one-question form to report weekly scores so updates take seconds.
Strategy 3: Visible impact. When teachers see huddles actually ending on time and decisions happening quickly, they become more willing to provide data. Post a simple chart showing average RTI meeting time dropping from 45 to 10 minutes. Celebrate when a student exits Tier 2. Make the connection between minimal tracking and actual results visible and specific.
The sample graphs you actually need (and will use)
Forget dashboards with 15 different visualizations. For effective RTI monitoring, you need exactly two graphs, and both take under 2 minutes to build.
Graph 1: Intervention Load Balance
| Intervention | Students |
|---|---|
| Reading fluency | 8 |
| Number talks | 5 |
| Guided reading | 12 |
| Math facts | 4 |
When guided reading hits 12+ students, you either need another group or should reassess whether all those students truly need that specific intervention.
Graph 2: Movement Tracker
| Movement | Count |
|---|---|
| Exited to Tier 1 | 6 |
| Remaining in Tier 2 | 18 |
| Moved to Tier 3 | 2 |
| New to Tier 2 | 5 |
This single graph tells your intervention story better than pages of individual student reports. If you're not moving at least 20% of students out of Tier 2 each quarter, your interventions are worth a closer look. Both graphs pull directly from your minimal tracker — no separate data entry, no complex formulas.
Common tracking mistakes that derail RTI teams
Even with minimal tracking, teams fall into the same traps that stretch 10-minute huddles into 45-minute marathons.
Mistake 1: Tracking fidelity instead of progress. Some teams obsess over whether interventions happened exactly as prescribed. Did the student attend all 5 sessions? Was it exactly 15 minutes? This fidelity tracking rarely changes decisions. If a student is improving, minor fidelity issues don't matter much. If they're not improving despite perfect fidelity, you need a different intervention anyway.
Mistake 2: Over-documenting for imagined audits. "What if the state asks for this data?" becomes an excuse for tracking everything. Your minimal tracker plus student work samples provide sufficient documentation. The comprehensive audit almost never materializes, but the daily burden of over-documentation is very real.
Mistake 3: Creating separate trackers for different subjects. One school maintained different spreadsheets for reading, math, behavior, and speech interventions. Students receiving multiple interventions showed up in multiple places with conflicting information. Put everything in one simple tracker. A student is a student regardless of which intervention they're in.
Mistake 4: Waiting for perfect data. "We can't make a decision until we have 6 data points" is often just inaction dressed up as process. If a student has declined three weeks straight, you don't need three more weeks of failure to confirm the trend. Make decisions with the data you have.
Making decisions with incomplete information
You'll never have perfect data in RTI. Students are absent. Assessments get skipped. Progress monitoring tools have error margins. Your tracker should reflect that reality, not pretend otherwise.
The 70% rule works well in practice: if you have roughly 70% of the data you'd ideally want, make the decision. Missing one week's score? Look at the overall trend. Student was absent for two sessions? Consider extending the timeline but don't restart from zero.
A fifth-grade team got stuck when their progress monitoring tool broke mid-year. Instead of waiting for a perfect replacement, they switched to simple curriculum-based measures — one-minute reading fluency checks, two-minute math computation probes. Less sophisticated, but more than enough to make intervention decisions.
Interventions are experiments, not prescriptions. You're trying something for 6–8 weeks to see if it works. If it doesn't, you adjust. The tracker just helps you notice the trend before too much time passes.
The hidden benefit of minimal tracking
When RTI teams strip away excessive documentation, something shifts: they actually start talking about instruction. Instead of debating data entry procedures, they discuss intervention techniques. Instead of building elaborate progress monitoring schedules, they share what's working in their small groups.
A middle school that simplified their tracking noticed this unexpectedly. Their RTI meetings started functioning like informal professional development. The math interventionist began demonstrating number talk strategies. The reading specialist shared fluency techniques. Teachers started dropping into each other's intervention blocks.
That doesn't happen when every meeting is consumed by spreadsheet management.
Technology that helps (or hurts) your process
Schools often believe technology will solve their RTI tracking problems. They invest in elaborate platforms with automatic graphing, built-in assessments, and comprehensive dashboards. Six months later, many are back to paper or basic spreadsheets.
Successful lightweight Tier 2 RTI tracker implementations tend to share a few traits: single point of entry with no multiple logins, mobile-friendly for quick updates, easy export to simple formats for huddle projection, and under 30 seconds per student to update.
The tools that actually get used consistently aren't always the most sophisticated. A shared Google Sheet with a simple template. A basic Airtable with filtered views. Even a well-organized paper binder with a consistent format. The technology matters less than keeping it minimal.
Some schools find that AI-powered operational software helps by automatically pulling progress monitoring scores from existing assessments, cutting out manual entry entirely. Others use automation to send weekly data reminders or generate simple graphs ahead of huddles. The point is that technology should reduce work, not add new tasks.
When to expand beyond minimal tracking
Minimal tracking works for most Tier 2 students, but certain situations call for more detail.
Students approaching special education evaluation need comprehensive documentation — intervention fidelity, detailed progress monitoring, behavioral observations. But don't let the needs of two or three students reshape your entire Tier 2 system. Grant-funded intervention programs sometimes require additional data tied to specific funding sources; create a supplemental tracker just for those requirements rather than complicating your core system. If you're testing a new intervention as part of a district pilot, you might need more detailed data to evaluate effectiveness — track it separately from your routine RTI process.
The default should always be minimal. Add complexity only when absolutely necessary and only for the specific students or programs that require it.
Making it stick: implementation timeline
Rolling this out doesn't need to be a big project. A rough sequence that tends to work:
-
Week 1 — Create your basic tracker template with just the essential fields. Don't overthink it.
-
Week 2 — Run your first 10-minute huddle using the protocol. It will feel rushed. That's fine.
-
Week 3 — Adjust based on what was actually missing, but resist adding too much.
-
Week 4 — Celebrate your first RTI meeting that ends on time.
-
Week 8 — Review and remove any fields that haven't influenced a single decision.
-
Week 12 — Share what's working with other grade levels or schools.
Don't try to perfect the system before you start. Begin simple and refine based on actual use, not anticipated needs.
Less tracking, more teaching
The most effective RTI teams share a pretty straightforward belief: the goal isn't perfect documentation, it's effective intervention. Every minute spent on unnecessary tracking is a minute that doesn't go toward actually helping students.
Your lightweight Tier 2 RTI tracker should answer three questions: Who's receiving what intervention? Is it working? What happens next? Everything else is optional at best and a distraction at worst.
When huddles consistently finish in 10 minutes, teachers have time to actually plan interventions. When tracking takes seconds instead of hours, interventionists can focus on instruction. When decisions happen quickly, students get help sooner.
The schools seeing real RTI progress aren't the ones with the most elaborate systems. They're the ones who figured out that minimal documentation and maximum instruction is the approach that actually moves students forward.
The schools seeing real RTI progress aren't the ones with the most elaborate systems. They're the ones who figured out that minimal documentation and maximum instruction is the approach that actually moves students forward.
Ready to elevate your classroom management?
Join 5,000+ educators using Skolyly to save time, engage students, and improve learning outcomes.